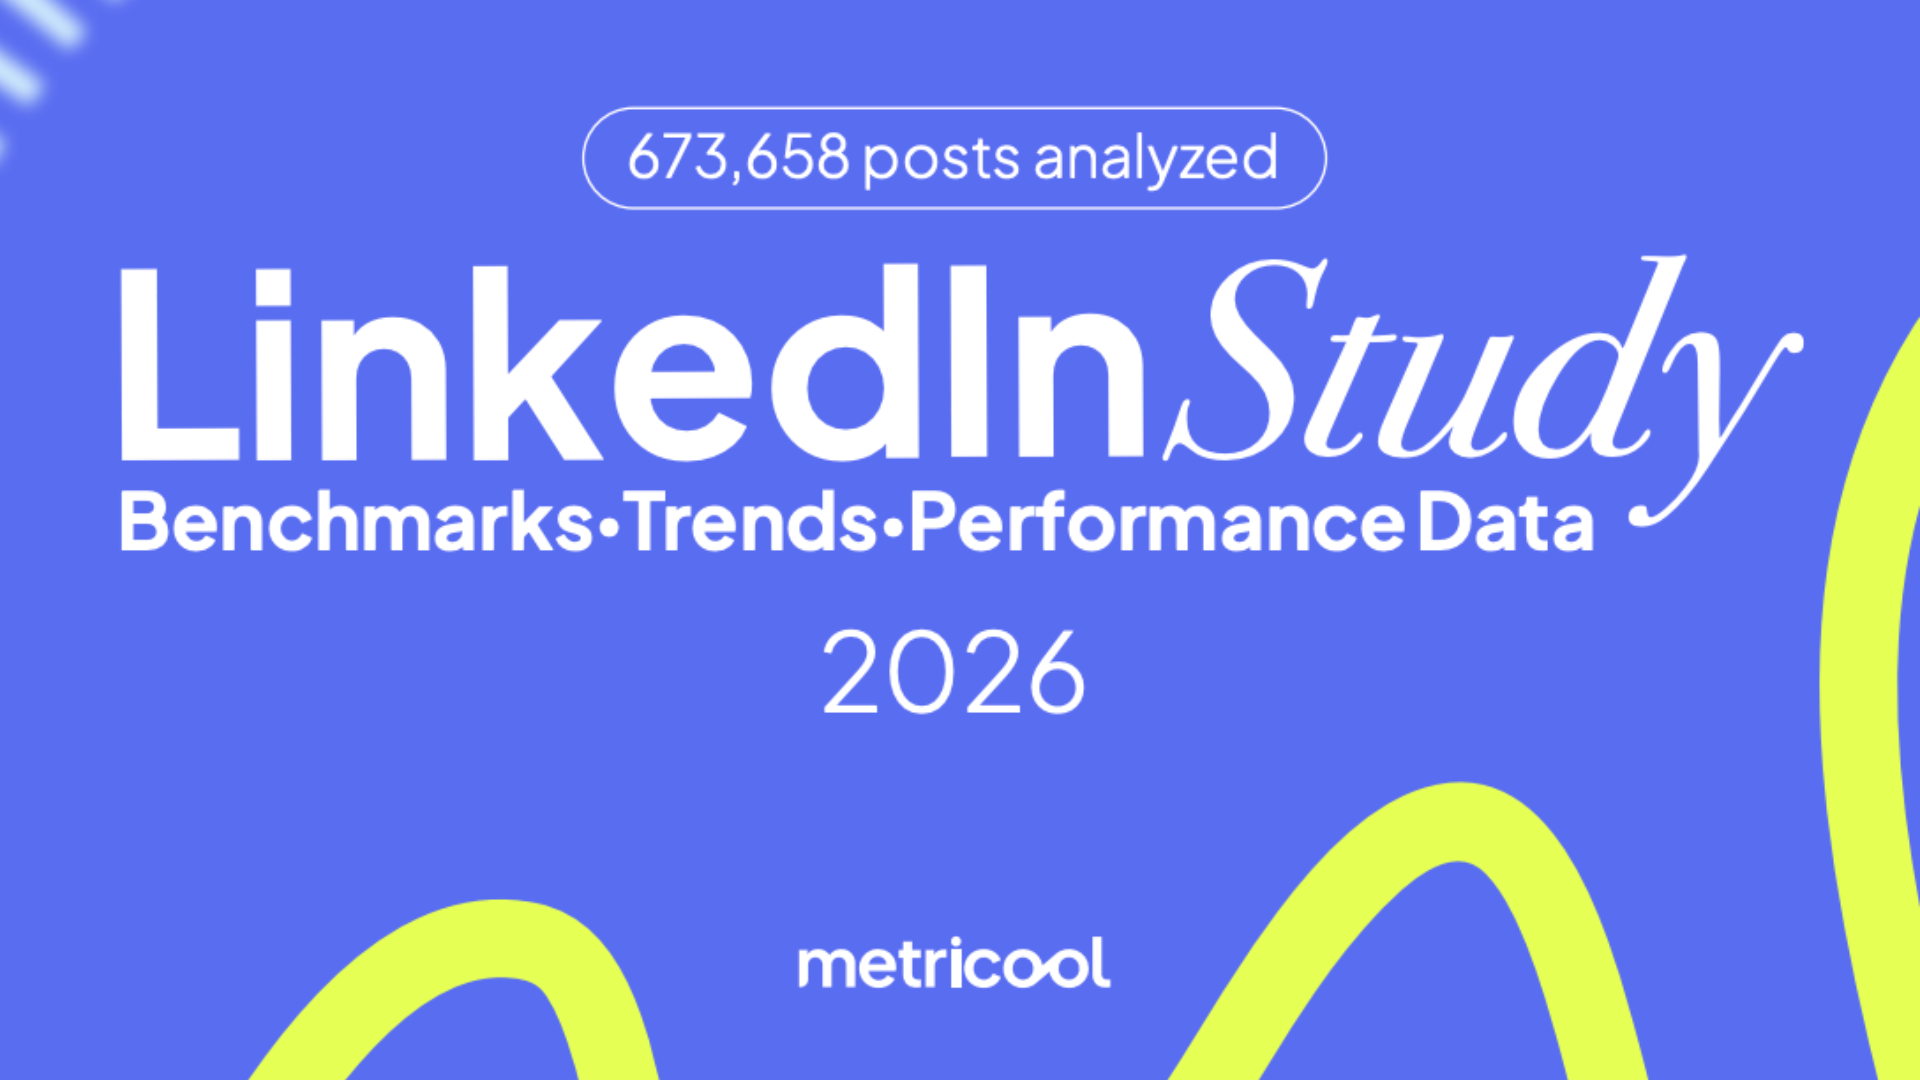
Likes, comments, and shares on LinkedIn fell across the board in 2026, but a new study from social media analytics platform Metricool found that overall engagement grew nearly 14% as clicks replaced public interactions as the dominant form of audience activity on the platform.
The study, which analyzed over 670,000 posts from over 63,000 LinkedIn accounts covering January through February of both 2025 and 2026, represents Metricool’s first report to include data from both LinkedIn Company Pages and Personal Profiles simultaneously.
Clicks Drive Engagement as Public Interactions Fall
Average impressions on LinkedIn Company Pages dropped 10% year over year, while likes fell 13%, comments declined 17%, and shares slid 11%. At the same time, clicks per post rose 5% and total engagement grew from 12.21% to 13.90%.
Metricool attributes the divergence to what it calls “invisible interactions,” a category that includes clicks on links, carousel slides, and videos. LinkedIn factors these actions into engagement calculations for Company Pages, even though they do not appear publicly on posts.
“People are interacting on LinkedIn more than ever, just in ways that aren’t visible to everyone else,” the report states.
Posting frequency also declined, with Company Pages averaging 2.34 posts per week in 2026 compared to 2.60 in 2025.
Personal Profiles Outperform Company Pages on Engagement
Personal Profiles generated a 63% higher engagement rate than Company Pages in 2026, despite both account types averaging comparable impressions per post. Company Pages averaged 831.96 impressions per post while Personal Profiles averaged 817.67. Interactions favored Personal Profiles by 8%, and Personal Profiles posted 30% more frequently, averaging 3.05 posts per week versus 2.34 for Company Pages.
The two account types produced sharply different interaction patterns. Personal Profiles received 237% more comments per post than Company Pages, while Company Pages were shared nearly 15 times more. The report noted that Company Pages averaged 1.16 shares per post compared to 0.08 for Personal Profiles.
“Brand content feels credible and safe to repost, so people share it. Personal content feels relatable and sparks conversations,” the report states.
Account Size and Growth
Only 6.89% of LinkedIn Company Pages gained enough followers to move into a higher size tier during the study period. Smaller accounts outperformed the average, with Tiny accounts (under 2,000 followers) growing at 7.13% and Small accounts (2,000 to 10,000 followers) at 7.97%. Growth rates fell sharply for larger pages, with Medium accounts (10,000 to 100,000 followers) at 3% and Big accounts (100,000 to 1 million followers) at 1%.
Engagement rates remained consistent across account sizes, ranging from 12.05% for Big accounts to 16.86% for Huge accounts with more than 1 million followers, suggesting that LinkedIn’s algorithm does not significantly penalize smaller accounts in terms of engagement relative to reach.
For Personal Profiles, metrics increased gradually across size tiers until the 100,000-follower threshold, at which point impressions and comments jumped approximately six times compared to the previous tier, and shares jumped 14 times.
Format Performance
Images accounted for 49.50% of all Company Page posts, making them the most used format, while video led Personal Profile usage at 40.11%. Despite their dominance in posting volume, both formats ranked near the bottom across performance metrics.
Carousels generated 49.52% engagement for Company Pages and averaged 1,234.18 impressions per post, outperforming images, which averaged 952.90 impressions and 5.77% engagement. Multi-image posts produced the highest engagement rate among Personal Profile formats at 3.71%.
Polls reached an average of 3,418.57 impressions per post on Company Pages, nearly three times the impressions of any other format, despite representing the least-used content type in the sample.
“Carousels get 11x more interactions than images, yet images are posted 6x more than carousels,” the report states.
Links and Hashtags
Posts with links performed differently across account types. Company Pages that included links averaged 51% more impressions and 41% more interactions than those without. For Personal Profiles, posts with links saw impressions drop by 27%, and interactions fell by 20%.
Posts that included at least one hashtag outperformed the average across both account types, generating 87% more impressions on Company Pages and 85% more on Personal Profiles. The report found that using too many hashtags reduced interactions and recommended limiting hashtag use to between one and five per post.
Comments, Timing, and Industry Performance
Posts that included a direct question generated 77% more comments than the platform average. Posts that explicitly asked users to leave a comment produced an 80% increase in comments.
Half of a LinkedIn post’s lifetime impressions occur within the first 48 hours of publication. For Personal Profiles, nearly 40% of all interactions happen on day one. Company Pages capture approximately 35% of interactions on day one, with both account types declining sharply by day three.
Among industries, Oil, Gas, and Mining led with an average of 3,103.47 impressions per post. Technology, Information, and Media posted the highest average frequency at 7.18 times per week. Financial Services generated the highest average number of interactions, at 174.13 per post.
Methodology: The study covered accounts worldwide. Metricool segmented all data by follower tier to prevent large accounts from skewing averages for smaller ones.
Image source: Metricool Follow this link for the full report
Dragomir is a Serbian freelance blog writer and translator. He is passionate about covering insightful stories and exploring topics such as influencer marketing, the creator economy, technology, business, and cyber fraud.














Likes, comments, and shares on LinkedIn fell across the board in 2026, but a new study from social media analytics platform Metricool found that overall engagement grew nearly 14% as clicks replaced public interactions as the dominant form of audience activity on the platform.
The study, which analyzed over 670,000 posts from over 63,000 LinkedIn accounts covering January through February of both 2025 and 2026, represents Metricool’s first report to include data from both LinkedIn Company Pages and Personal Profiles simultaneously.
Clicks Drive Engagement as Public Interactions Fall
Average impressions on LinkedIn Company Pages dropped 10% year over year, while likes fell 13%, comments declined 17%, and shares slid 11%. At the same time, clicks per post rose 5% and total engagement grew from 12.21% to 13.90%.
Metricool attributes the divergence to what it calls “invisible interactions,” a category that includes clicks on links, carousel slides, and videos. LinkedIn factors these actions into engagement calculations for Company Pages, even though they do not appear publicly on posts.
“People are interacting on LinkedIn more than ever, just in ways that aren’t visible to everyone else,” the report states.
Posting frequency also declined, with Company Pages averaging 2.34 posts per week in 2026 compared to 2.60 in 2025.
Personal Profiles Outperform Company Pages on Engagement
Personal Profiles generated a 63% higher engagement rate than Company Pages in 2026, despite both account types averaging comparable impressions per post. Company Pages averaged 831.96 impressions per post while Personal Profiles averaged 817.67. Interactions favored Personal Profiles by 8%, and Personal Profiles posted 30% more frequently, averaging 3.05 posts per week versus 2.34 for Company Pages.
The two account types produced sharply different interaction patterns. Personal Profiles received 237% more comments per post than Company Pages, while Company Pages were shared nearly 15 times more. The report noted that Company Pages averaged 1.16 shares per post compared to 0.08 for Personal Profiles.
“Brand content feels credible and safe to repost, so people share it. Personal content feels relatable and sparks conversations,” the report states.
Account Size and Growth
Only 6.89% of LinkedIn Company Pages gained enough followers to move into a higher size tier during the study period. Smaller accounts outperformed the average, with Tiny accounts (under 2,000 followers) growing at 7.13% and Small accounts (2,000 to 10,000 followers) at 7.97%. Growth rates fell sharply for larger pages, with Medium accounts (10,000 to 100,000 followers) at 3% and Big accounts (100,000 to 1 million followers) at 1%.
Engagement rates remained consistent across account sizes, ranging from 12.05% for Big accounts to 16.86% for Huge accounts with more than 1 million followers, suggesting that LinkedIn’s algorithm does not significantly penalize smaller accounts in terms of engagement relative to reach.
For Personal Profiles, metrics increased gradually across size tiers until the 100,000-follower threshold, at which point impressions and comments jumped approximately six times compared to the previous tier, and shares jumped 14 times.
Format Performance
Images accounted for 49.50% of all Company Page posts, making them the most used format, while video led Personal Profile usage at 40.11%. Despite their dominance in posting volume, both formats ranked near the bottom across performance metrics.
Carousels generated 49.52% engagement for Company Pages and averaged 1,234.18 impressions per post, outperforming images, which averaged 952.90 impressions and 5.77% engagement. Multi-image posts produced the highest engagement rate among Personal Profile formats at 3.71%.
Polls reached an average of 3,418.57 impressions per post on Company Pages, nearly three times the impressions of any other format, despite representing the least-used content type in the sample.
“Carousels get 11x more interactions than images, yet images are posted 6x more than carousels,” the report states.
Links and Hashtags
Posts with links performed differently across account types. Company Pages that included links averaged 51% more impressions and 41% more interactions than those without. For Personal Profiles, posts with links saw impressions drop by 27%, and interactions fell by 20%.
Posts that included at least one hashtag outperformed the average across both account types, generating 87% more impressions on Company Pages and 85% more on Personal Profiles. The report found that using too many hashtags reduced interactions and recommended limiting hashtag use to between one and five per post.
Comments, Timing, and Industry Performance
Posts that included a direct question generated 77% more comments than the platform average. Posts that explicitly asked users to leave a comment produced an 80% increase in comments.
Half of a LinkedIn post’s lifetime impressions occur within the first 48 hours of publication. For Personal Profiles, nearly 40% of all interactions happen on day one. Company Pages capture approximately 35% of interactions on day one, with both account types declining sharply by day three.
Among industries, Oil, Gas, and Mining led with an average of 3,103.47 impressions per post. Technology, Information, and Media posted the highest average frequency at 7.18 times per week. Financial Services generated the highest average number of interactions, at 174.13 per post.
Methodology: The study covered accounts worldwide. Metricool segmented all data by follower tier to prevent large accounts from skewing averages for smaller ones.
Image source: Metricool
Follow this link for the full report
Subscribe to Our Newsletter
Check Out Our Podcast