








Technology
Livestream Analytics Platform Streams Charts Adds YouTube VOD Tracking

Streams Charts, a livestreaming analytics platform, has added tracking of YouTube stream VODs, and its analysis of 100,000 streams found that the median replay gathered views equal to 29 times its average live audience.
Until now, Streams Charts measured a stream only while it was live. The company said a large share of the audience for many YouTube broadcasts arrives later. As an example, it cited a TheBurntPeanut stream on October 21 that averaged 58.8K live viewers. The VOD has since gathered 2.1M views, 35.7 times the live average.
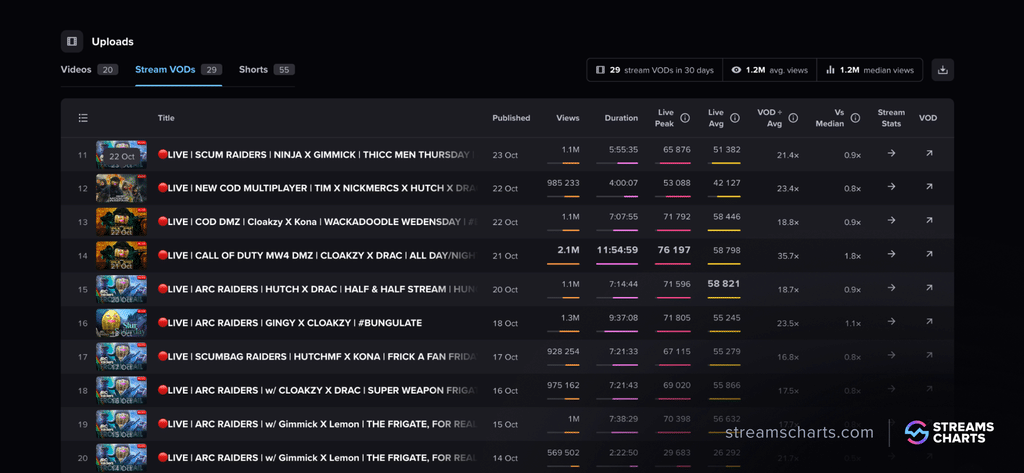
The data appears in a VODs & Shorts tab, which shows each stream VOD next to the peak and average live viewers of the same broadcast. A creator’s linked YouTube channels appear together. On xQc’s page, his main, Clips, Gaming, and Reacts channels can be toggled one by one. The section also covers regular YouTube videos, recorded livestreams, and Shorts.
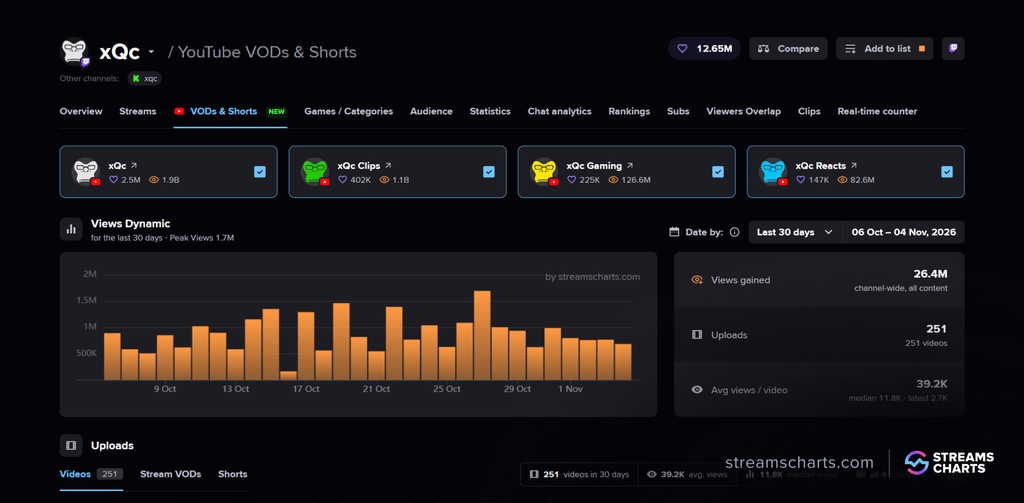
Data updates daily. Streams Charts added three metrics: “VOD ÷ avg,” which compares VOD views with the live average; “Vs median,” which highlights uploads that beat a channel’s usual performance; and “Views gained,” which tracks growth over any date period. YouTube VODs & Shorts is available on the PRO plan. Full stream VOD statistics require access to YouTube data.
What the Analysis Showed
Streams Charts analyzed 100,000 YouTube streams with at least 1,000 average viewers. The multiplier shrank as streams got bigger: 32 times for streams averaging 1K to 5K viewers and 5.6 times for those above 100K.
Most streams still collected the bulk of their views on the day. The median VOD had 86% of its views by the first check after the broadcast. However, 40% of streams added at least a fifth of their views afterward, and for one in six, the replay outperformed the live broadcast.
“Live viewership has always been the core of what we measure, but it tells only part of a stream’s story,” said Nazar Babenko, Product Manager at Streams Charts. “Many broadcasts keep finding their audience on YouTube for days and weeks after they end.”
The findings are Streams Charts’ own analysis, and the company did not disclose when each “check” took place.
Fitting a Product-Release Pattern
The release continues a run of product launches from the company this year. In July, Streams Charts launched IRL Map, a tool that plots creators’ streaming history on a world map alongside viewership data. In August, it released Brand Radar, which tracks brand and keyword mentions across live chats and channel bios on Twitch, Kick and YouTube Gaming. In September, it extended its Audience Geo & Demographics tool from Twitch to YouTube and Kick.
The VOD data speaks to a gap in how livestream audiences are measured. Scott Graffius, who has tracked engagement half-life across more than five million social post data points since 2018, found that a YouTube video reaches half of its lifetime engagement in 10.6 days. For comparison, a TikTok video’s average half-life rounds to zero minutes, in his data. Live concurrent viewership alone does not capture that longer tail.
Subscribe to Our Newsletter
Check Out Our Podcast