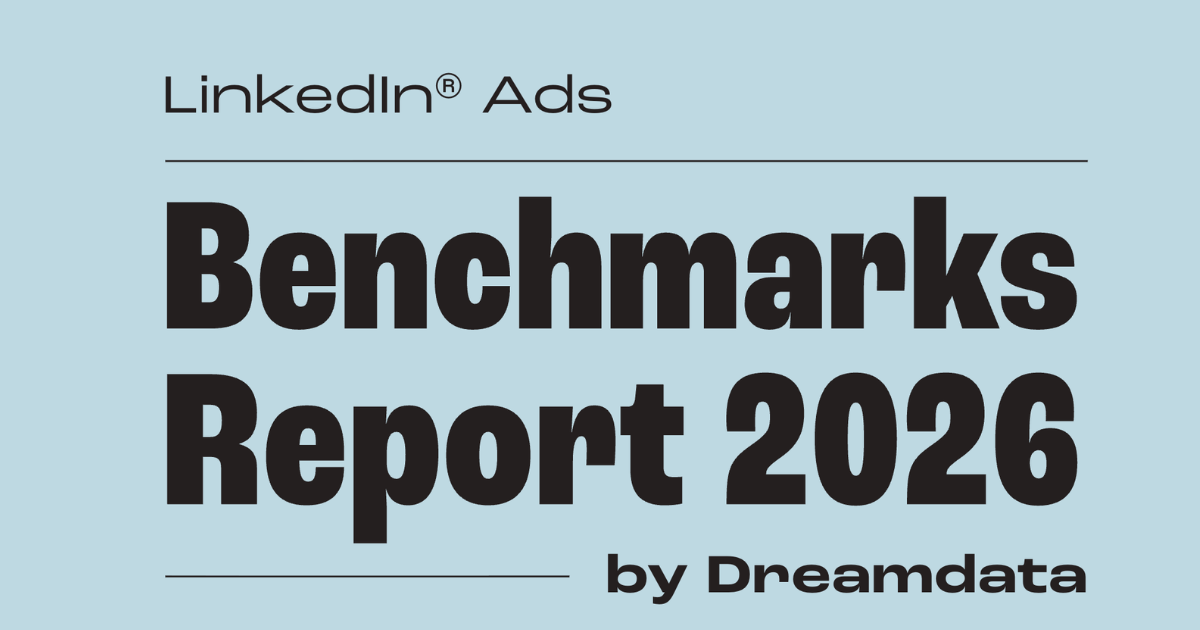
LinkedIn generated a 121% return on ad spend among business-to-business (B2B) marketers in 2025, outperforming Google Search at 67% and Meta at 51%, according to a new benchmarks report published by Dreamdata, a B2B attribution and analytics platform.
The report, which analyzed aggregated campaign data covering more than 66 million sessions across more than 3.5 million customer journeys from thousands of Dreamdata customers, also tracked year-over-year shifts in budget allocation, cost metrics, and buyer journey complexity across the three major ad networks.
Budget Share Shifts Toward LinkedIn
LinkedIn accounted for 41% of paid social ad budgets among Dreamdata customers in 2025, up from 39% in 2024, making it the largest single destination when Google’s network is broken down by sub-channel. The Google Network as a whole, encompassing Search, Display, Smart Ads, and YouTube, captured 46% of total budgets, while Meta held steady at 8%.
Within Google’s network, non-branded search spending declined from 37% of total ad budgets in 2024 to 33% in 2025. The report attributes the pullback, in part, to rising costs and declining engagement on non-branded search terms. Cost-per-click for non-branded Google Search rose 29.36% between August 2024 and July 2025, while click-through rates fell 26.16% over the same period.
Company-Level Metrics Tell a Different Story on Cost
At the individual-contact level, LinkedIn has the highest cost among the three platforms. Cost per contact influenced rose 88.6% year over year to €1,033.29, compared with increases of 32.2% for Google Search (to €362.39) and 3.9% for Meta (to €231.77).
When measured at the company level (a distinction the report frames as more appropriate for B2B marketing, where buying decisions typically involve multiple stakeholders), LinkedIn’s cost per company influenced fell from €154 in 2024 to €70.11 in 2025, a 54% improvement. Meta’s company-level cost dropped from €299 to €128.70, and Google Search declined from €222 to €110.37.
Dreamdata notes that the improvement in LinkedIn’s company-level metric was driven in part by the release of a new IP-to-company resolution engine in 2025, which the company says identifies up to 15 times more companies, and by expanded data access through LinkedIn’s new Company Intelligence API.
The B2B Buyer Journey Grows Longer
The average B2B customer journey extended from 211 days in the prior period to 272 days in 2025, measured from first marketing touch to closed revenue. Within that total, the time between marketing-qualified lead and sales-qualified lead shortened from 107 days to 92 days, and the time spent in the active sales pipeline dropped from 62 days to 52 days.
“Much of the research, education, and internal alignment now appears to happen before a lead becomes an MQL (Marketing Qualified Lead),” the report states. “This data could be telling us that by the time sales is engaged, buyers are more informed and closer to making a decision.”
The finding marks a shift from the prior year’s report, which recorded 70% of the buyer journey as occurring before the sales pipeline. The 2026 report places that figure at 81%.
Buying group complexity also increased. The average B2B deal involved 10 stakeholders in 2025, up from 6.8 in 2024, and required 88 total touchpoints across four channels, compared with 76 touchpoints across 3.7 channels the year prior.
LinkedIn’s Role Expands Across the Funnel
LinkedIn Ads accounted for 24.2% of all sessions at the marketing-qualified lead stage, rising to 30.2% at the sales-qualified lead stage and 28.3% at the new business stage, representing a reversal from the prior year’s pattern in which LinkedIn’s influence declined as prospects moved further down the funnel.
The report also finds that the average time from a first LinkedIn Ads impression to closed revenue is 281 days, compared with 214 days from a first LinkedIn Ads conversion and 212 days from a first ad engagement. The near-identical timelines for engagement and conversion signals led Dreamdata to conclude that ad engagement carries comparable predictive weight to form fills in long B2B buying cycles.
When LinkedIn Ads paid engagement data is incorporated into revenue attribution modeling, Dreamdata records a 7.7x increase in measured ROI attributed to the platform.
Organic Company Page Activity Tied to Closed Deals
Using LinkedIn’s Company Intelligence API for the first time, the report tracked organic Company Page impressions alongside paid activity. The data shows that 9.4% of marketing-qualified leads include at least one organic Company Page impression, rising to 15% at the sales-qualified lead stage and 17.9% among closed new business deals. Among deals that included a Company Page impression, the average time from first organic impression to deal close was 90 days.
Conversions API Adoption Reaches 75%
Three-quarters of Dreamdata customers running LinkedIn Ads had integrated LinkedIn’s Conversions API by the time of the report’s publication. LinkedIn’s internal data indicates that CAPI users see an average 20% reduction in cost per action and a 31% increase in attributed conversions. Of CAPI users tracked in Dreamdata’s data, 64% optimize toward pipeline conversions and revenue rather than top-of-funnel metrics.
Methodology: The report is based on aggregated, anonymized data from Dreamdata customers who consented to inclusion in the study. Dreamdata is a LinkedIn Marketing Partner for Signals, Reporting, Audiences, and Attribution.
Dragomir is a Serbian freelance blog writer and translator. He is passionate about covering insightful stories and exploring topics such as influencer marketing, the creator economy, technology, business, and cyber fraud.















LinkedIn generated a 121% return on ad spend among business-to-business (B2B) marketers in 2025, outperforming Google Search at 67% and Meta at 51%, according to a new benchmarks report published by Dreamdata, a B2B attribution and analytics platform.
The report, which analyzed aggregated campaign data covering more than 66 million sessions across more than 3.5 million customer journeys from thousands of Dreamdata customers, also tracked year-over-year shifts in budget allocation, cost metrics, and buyer journey complexity across the three major ad networks.
Budget Share Shifts Toward LinkedIn
LinkedIn accounted for 41% of paid social ad budgets among Dreamdata customers in 2025, up from 39% in 2024, making it the largest single destination when Google’s network is broken down by sub-channel. The Google Network as a whole, encompassing Search, Display, Smart Ads, and YouTube, captured 46% of total budgets, while Meta held steady at 8%.
Within Google’s network, non-branded search spending declined from 37% of total ad budgets in 2024 to 33% in 2025. The report attributes the pullback, in part, to rising costs and declining engagement on non-branded search terms. Cost-per-click for non-branded Google Search rose 29.36% between August 2024 and July 2025, while click-through rates fell 26.16% over the same period.
Company-Level Metrics Tell a Different Story on Cost
At the individual-contact level, LinkedIn has the highest cost among the three platforms. Cost per contact influenced rose 88.6% year over year to €1,033.29, compared with increases of 32.2% for Google Search (to €362.39) and 3.9% for Meta (to €231.77).
When measured at the company level (a distinction the report frames as more appropriate for B2B marketing, where buying decisions typically involve multiple stakeholders), LinkedIn’s cost per company influenced fell from €154 in 2024 to €70.11 in 2025, a 54% improvement. Meta’s company-level cost dropped from €299 to €128.70, and Google Search declined from €222 to €110.37.
Dreamdata notes that the improvement in LinkedIn’s company-level metric was driven in part by the release of a new IP-to-company resolution engine in 2025, which the company says identifies up to 15 times more companies, and by expanded data access through LinkedIn’s new Company Intelligence API.
The B2B Buyer Journey Grows Longer
The average B2B customer journey extended from 211 days in the prior period to 272 days in 2025, measured from first marketing touch to closed revenue. Within that total, the time between marketing-qualified lead and sales-qualified lead shortened from 107 days to 92 days, and the time spent in the active sales pipeline dropped from 62 days to 52 days.
“Much of the research, education, and internal alignment now appears to happen before a lead becomes an MQL (Marketing Qualified Lead),” the report states. “This data could be telling us that by the time sales is engaged, buyers are more informed and closer to making a decision.”
The finding marks a shift from the prior year’s report, which recorded 70% of the buyer journey as occurring before the sales pipeline. The 2026 report places that figure at 81%.
Buying group complexity also increased. The average B2B deal involved 10 stakeholders in 2025, up from 6.8 in 2024, and required 88 total touchpoints across four channels, compared with 76 touchpoints across 3.7 channels the year prior.
LinkedIn’s Role Expands Across the Funnel
LinkedIn Ads accounted for 24.2% of all sessions at the marketing-qualified lead stage, rising to 30.2% at the sales-qualified lead stage and 28.3% at the new business stage, representing a reversal from the prior year’s pattern in which LinkedIn’s influence declined as prospects moved further down the funnel.
The report also finds that the average time from a first LinkedIn Ads impression to closed revenue is 281 days, compared with 214 days from a first LinkedIn Ads conversion and 212 days from a first ad engagement. The near-identical timelines for engagement and conversion signals led Dreamdata to conclude that ad engagement carries comparable predictive weight to form fills in long B2B buying cycles.
When LinkedIn Ads paid engagement data is incorporated into revenue attribution modeling, Dreamdata records a 7.7x increase in measured ROI attributed to the platform.
Organic Company Page Activity Tied to Closed Deals
Using LinkedIn’s Company Intelligence API for the first time, the report tracked organic Company Page impressions alongside paid activity. The data shows that 9.4% of marketing-qualified leads include at least one organic Company Page impression, rising to 15% at the sales-qualified lead stage and 17.9% among closed new business deals. Among deals that included a Company Page impression, the average time from first organic impression to deal close was 90 days.
Conversions API Adoption Reaches 75%
Three-quarters of Dreamdata customers running LinkedIn Ads had integrated LinkedIn’s Conversions API by the time of the report’s publication. LinkedIn’s internal data indicates that CAPI users see an average 20% reduction in cost per action and a 31% increase in attributed conversions. Of CAPI users tracked in Dreamdata’s data, 64% optimize toward pipeline conversions and revenue rather than top-of-funnel metrics.
Methodology: The report is based on aggregated, anonymized data from Dreamdata customers who consented to inclusion in the study. Dreamdata is a LinkedIn Marketing Partner for Signals, Reporting, Audiences, and Attribution.
Image source: Dreamdata
Get the full report here
Subscribe to Our Newsletter
Check Out Our Podcast