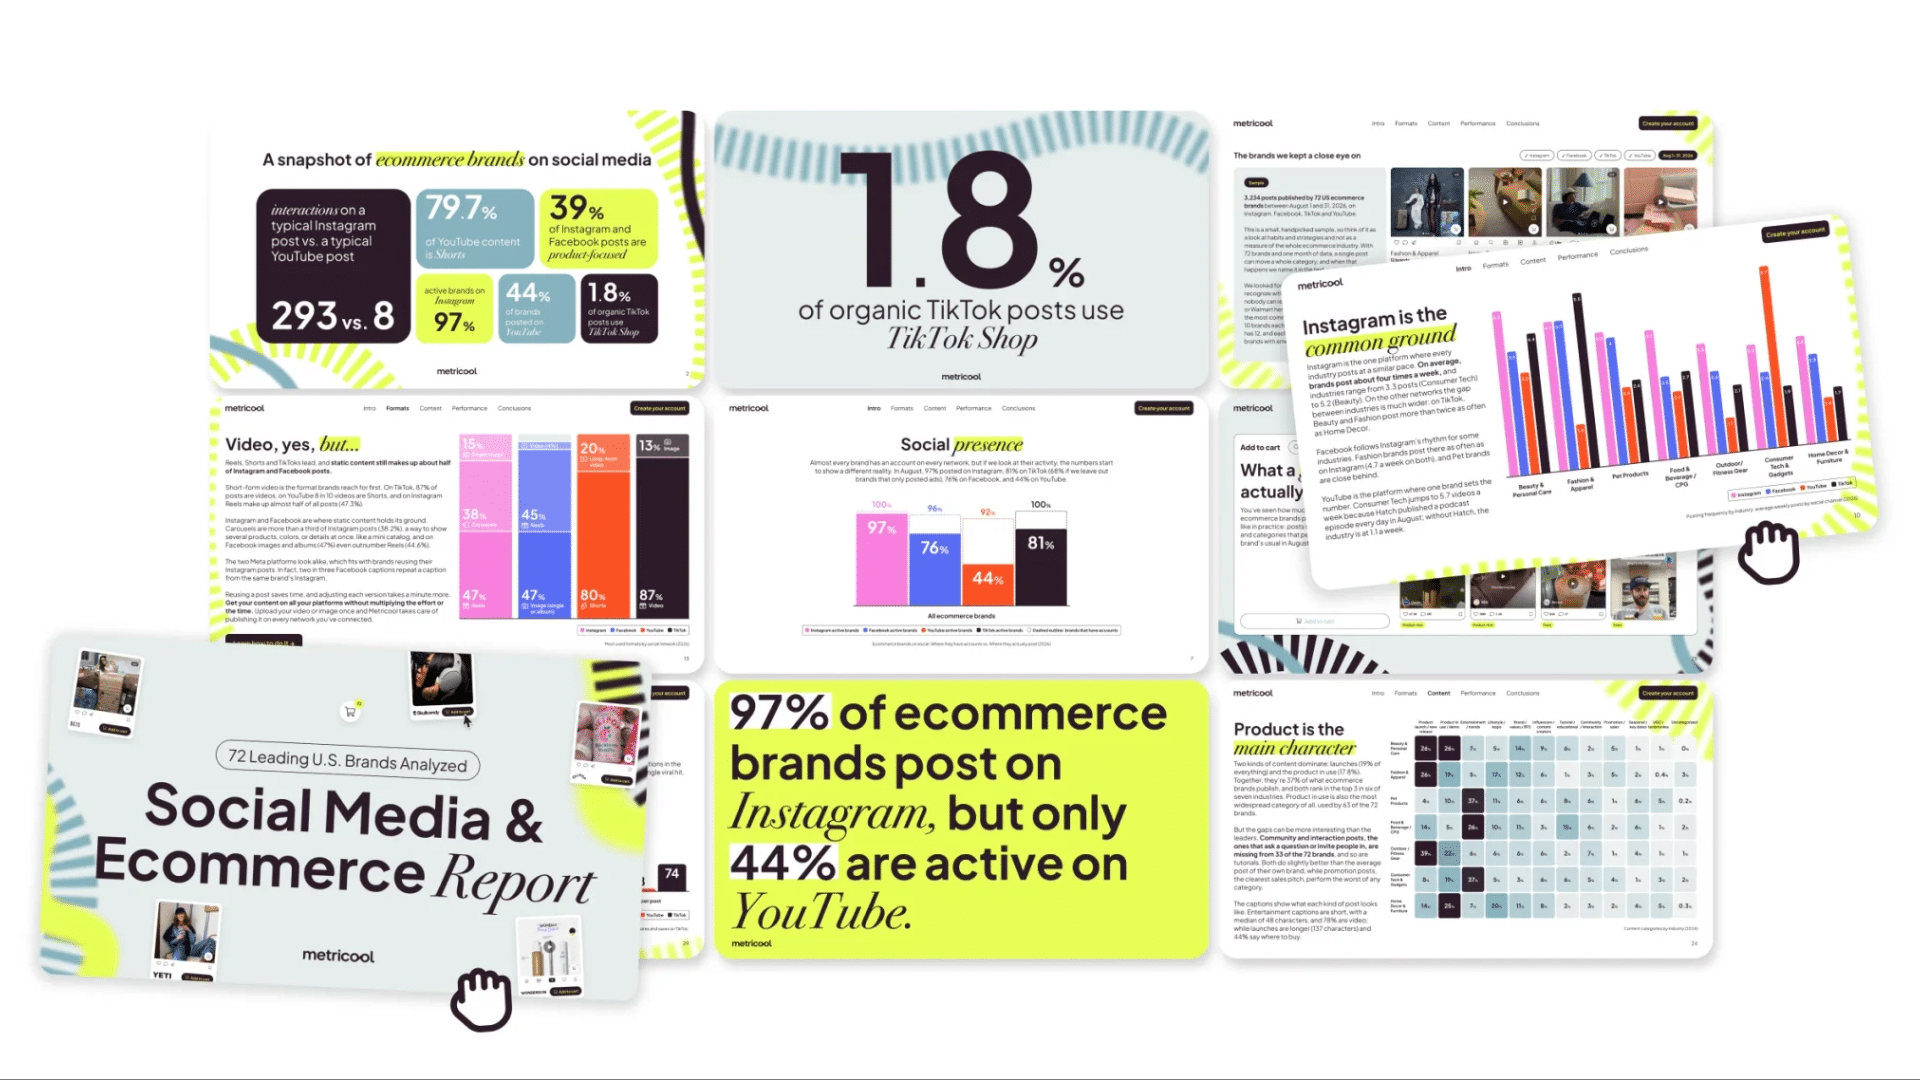
A typical Instagram post from 72 U.S. e-commerce brands drew 293 interactions in August, compared with 8 on YouTube, according to a report from social media management platform Metricool. The report analyzed 3,234 posts published by the brands on Instagram, Facebook, TikTok and YouTube between Aug. 1 and 31, 2026. Within the same brand, captions with a call to action performed the same as captions without one.
The sample covers seven categories: Fashion & Apparel (12 brands), and Home Decor & Furniture, Consumer Tech & Gadgets, Beauty & Personal Care, Pet Products, Outdoor/Fitness Gear, and Food & Beverage/CPG (10 brands each). Metricool describes it as a small, handpicked sample that reflects brand habits and strategies rather than the whole ecommerce industry. It excluded brands such as Nike and Walmart.
Instagram Concentrates Engagement
Nearly every brand in the sample has an account on each network, but fewer posted on all of them in August. Ninety-seven percent posted on Instagram, 81% on TikTok, 76% on Facebook and 44% on YouTube. The TikTok figure falls to 68% when brands that posted only ads are excluded.
Median interactions per organic post were 293 on Instagram, 74 on TikTok, 9 on Facebook and 8 on YouTube. Metricool defines interactions differently by platform: likes and comments on Instagram and YouTube, shares on Facebook, and shares and saves on TikTok. The comparison across networks is therefore not like-for-like. The report excluded 267 Instagram posts that hide their likes from the medians.
Instagram has the largest audience in the sample, at 39.7 million followers, and collected 2.1 million interactions in the month, more than twice TikTok’s 991,000. Brands post about four times a week on Instagram on average, with category averages ranging from 3.3 for Consumer Tech to 5.2 for Beauty.
Audience size did not track post-level engagement. Food & Beverage has the largest Instagram following at 9.5 million and a median of 162 interactions per post. Beauty & Personal Care has 5.4 million followers and a median of 1,074. Eight of Beauty’s 10 Instagram brands and seven of its eight TikTok brands beat the overall median for their platform. Outdoor/Fitness Gear ranked second on both and was the only category with notable Facebook traction, at a median of 55 interactions against 9 across the sample.
Content is often reused across networks. Two in three Facebook captions repeat a caption from the same brand’s Instagram, and 32 Facebook posts from 13 brands still say “link in bio.” About one in four YouTube videos has a title that also appears in the brand’s TikTok or Instagram captions. In Beauty & Personal Care, the share is 47%.
Calls to Action and Hard Sells Show No Lift
Metricool read 2,526 captions from 71 brands on Instagram, Facebook, and TikTok. Thirty-six percent asked viewers to take an action, and 21% of those asks pointed to a retailer. Within the same brand, captions with a call to action performed the same as those without. The report did not include YouTube in this analysis because the data covers titles only, and it excluded TikTok ads.
Usage varied by category. Beauty (58%) and Outdoor/Fitness (53%) included calls to action most often, compared with 21% for Consumer Tech and 19% for Home Decor. A third of Facebook’s asks were URLs (34%), against 14% on Instagram and 9% on TikTok. “Link in bio” made up 18% of Instagram asks.
Explicit promotion accounted for 3.2% of posts and was the category that performed worst against a brand’s own average. Product launches (19% of posts) and product-in-use content (17.8%) together made up 37% of what the brands published.
On TikTok, 1.8% of organic posts carried a TikTok Shop tag, and 84% of all tagged posts were ads. Tagged posts reached about a fifth fewer views than their brand’s usual, based on 49 posts, most of them ads. Home Decor & Furniture was the only category that did not use the feature. Organic posts named a retail partner 9.3% of the time. In Beauty, 31% of organic TikTok posts mentioned at least one retailer, against 0% in fashion, tech, home decor, and pets. BÉIS posted nine teasers with the launch date and time in the five days before its Disney collaboration, and they reached a median of 91,300 views, about five times its other posts.
Community Posts and Tutorials Ran Slightly Above Norm
Community and interaction posts, which ask a question or invite people in, and tutorials were each missing from 33 of the 72 brands. Both performed slightly better than the average post of the brand that published them.
Format mix varied by network. Reels were 47.3% of Instagram posts and carousels 38.2%, so carousels and single images together made up 52.7%. On Facebook, images and albums (47%) outnumbered Reels (44.6%). Eighty-seven percent of TikTok posts were video, and Shorts were about 80% of YouTube content.
YouTube skewed toward entertainment, at 40.1% of content, because Hatch published a daily podcast that accounts for 96 of the 354 videos. Hatch also drives Consumer Tech’s YouTube posting rate of 5.7 videos a week, which falls to 1.1 without it.
Home Decor & Furniture was the least video-driven category, with Reels at 32.7% of Instagram posts and video at 68.4% of TikTok posts. Outer and Sixpenny did not post a single Instagram Reel in August.
Metricool reports medians rather than averages so that a single viral post does not skew the results. The sample covers one month.
Image source: Metricool The full report can be foundhere
Dragomir is a Serbian freelance blog writer and translator. He is passionate about covering insightful stories and exploring topics such as influencer marketing, the creator economy, technology, business, and cyber fraud.















A typical Instagram post from 72 U.S. e-commerce brands drew 293 interactions in August, compared with 8 on YouTube, according to a report from social media management platform Metricool. The report analyzed 3,234 posts published by the brands on Instagram, Facebook, TikTok and YouTube between Aug. 1 and 31, 2026. Within the same brand, captions with a call to action performed the same as captions without one.
The sample covers seven categories: Fashion & Apparel (12 brands), and Home Decor & Furniture, Consumer Tech & Gadgets, Beauty & Personal Care, Pet Products, Outdoor/Fitness Gear, and Food & Beverage/CPG (10 brands each). Metricool describes it as a small, handpicked sample that reflects brand habits and strategies rather than the whole ecommerce industry. It excluded brands such as Nike and Walmart.
Instagram Concentrates Engagement
Nearly every brand in the sample has an account on each network, but fewer posted on all of them in August. Ninety-seven percent posted on Instagram, 81% on TikTok, 76% on Facebook and 44% on YouTube. The TikTok figure falls to 68% when brands that posted only ads are excluded.
Median interactions per organic post were 293 on Instagram, 74 on TikTok, 9 on Facebook and 8 on YouTube. Metricool defines interactions differently by platform: likes and comments on Instagram and YouTube, shares on Facebook, and shares and saves on TikTok. The comparison across networks is therefore not like-for-like. The report excluded 267 Instagram posts that hide their likes from the medians.
Instagram has the largest audience in the sample, at 39.7 million followers, and collected 2.1 million interactions in the month, more than twice TikTok’s 991,000. Brands post about four times a week on Instagram on average, with category averages ranging from 3.3 for Consumer Tech to 5.2 for Beauty.
Audience size did not track post-level engagement. Food & Beverage has the largest Instagram following at 9.5 million and a median of 162 interactions per post. Beauty & Personal Care has 5.4 million followers and a median of 1,074. Eight of Beauty’s 10 Instagram brands and seven of its eight TikTok brands beat the overall median for their platform. Outdoor/Fitness Gear ranked second on both and was the only category with notable Facebook traction, at a median of 55 interactions against 9 across the sample.
Content is often reused across networks. Two in three Facebook captions repeat a caption from the same brand’s Instagram, and 32 Facebook posts from 13 brands still say “link in bio.” About one in four YouTube videos has a title that also appears in the brand’s TikTok or Instagram captions. In Beauty & Personal Care, the share is 47%.
Calls to Action and Hard Sells Show No Lift
Metricool read 2,526 captions from 71 brands on Instagram, Facebook, and TikTok. Thirty-six percent asked viewers to take an action, and 21% of those asks pointed to a retailer. Within the same brand, captions with a call to action performed the same as those without. The report did not include YouTube in this analysis because the data covers titles only, and it excluded TikTok ads.
Usage varied by category. Beauty (58%) and Outdoor/Fitness (53%) included calls to action most often, compared with 21% for Consumer Tech and 19% for Home Decor. A third of Facebook’s asks were URLs (34%), against 14% on Instagram and 9% on TikTok. “Link in bio” made up 18% of Instagram asks.
Explicit promotion accounted for 3.2% of posts and was the category that performed worst against a brand’s own average. Product launches (19% of posts) and product-in-use content (17.8%) together made up 37% of what the brands published.
On TikTok, 1.8% of organic posts carried a TikTok Shop tag, and 84% of all tagged posts were ads. Tagged posts reached about a fifth fewer views than their brand’s usual, based on 49 posts, most of them ads. Home Decor & Furniture was the only category that did not use the feature. Organic posts named a retail partner 9.3% of the time. In Beauty, 31% of organic TikTok posts mentioned at least one retailer, against 0% in fashion, tech, home decor, and pets. BÉIS posted nine teasers with the launch date and time in the five days before its Disney collaboration, and they reached a median of 91,300 views, about five times its other posts.
Community Posts and Tutorials Ran Slightly Above Norm
Community and interaction posts, which ask a question or invite people in, and tutorials were each missing from 33 of the 72 brands. Both performed slightly better than the average post of the brand that published them.
Format mix varied by network. Reels were 47.3% of Instagram posts and carousels 38.2%, so carousels and single images together made up 52.7%. On Facebook, images and albums (47%) outnumbered Reels (44.6%). Eighty-seven percent of TikTok posts were video, and Shorts were about 80% of YouTube content.
YouTube skewed toward entertainment, at 40.1% of content, because Hatch published a daily podcast that accounts for 96 of the 354 videos. Hatch also drives Consumer Tech’s YouTube posting rate of 5.7 videos a week, which falls to 1.1 without it.
Home Decor & Furniture was the least video-driven category, with Reels at 32.7% of Instagram posts and video at 68.4% of TikTok posts. Outer and Sixpenny did not post a single Instagram Reel in August.
Metricool reports medians rather than averages so that a single viral post does not skew the results. The sample covers one month.
Image source: Metricool
The full report can be found here
Subscribe to Our Newsletter
Check Out Our Podcast