Creator content aimed at the 2025 holiday season grew faster than any previous year on record, and the flood mostly did not pay off. According to a new report from Traackr, drawing on more than 770,000 creators and 12 million pieces of content across Beauty, Personal Care, Fashion, Food & Beverage, and Adult Beverage, overall holiday creator posts rose 73% year over year, with Personal Care more than doubling (+132%) and Beauty nearly doing the same (+95%).
But a separate benchmark of the Top 25 brands by Traackr’s Brand Vitality Score (VIT) against the rest of the market shows the extra volume did not translate evenly into results. The brands that came out ahead did not simply post more. They built different relationships before the season started.
Creator Spend Rose With the Content
Payment data provided by Lumanu, drawn from more than 140,000 creator payouts totaling over $600 million in flat-fee social spend, shows total creator spend climbed roughly 60% from spring 2025 to its December peak. The median December payout hit $1,750, the highest of the year, up from a typical $1,100 to $1,200.
Per-post pricing ranged from $600 for a solo TikTok to $2,500 for a standalone Instagram Reel, with YouTube at $700 and Instagram Stories and Feed at $1,166 and $1,200 respectively. Once a deal bundled multiple deliverables, which happened 58% of the time for Reels, pricing consolidated into a tight $4,600 to $5,600 band regardless of channel mix.
“You can see the holiday crush in the payment data before you see it anywhere else: prices climb, the same creators get booked again and again, and everyone is competing for the same few weeks,” said Tony Tran, CEO and founder of Lumanu.
What Separated Leaders From the Rest
Traackr’s Top 25 brands in each category earned 57% of their holiday attention from retained creators, meaning those who mentioned the brand in both Q3 and Q4 2025, compared with 51% for the rest of the market. The gap was widest in Beauty, where leaders pulled 70% of attention from returning creators versus 52% for everyone else; Personal Care was the lone exception, with leaders’ retained share running 17 points below the market’s.
Leaders also grew attention across every creator tier, from VIP down to nano, while the rest of the market lost ground at the top: VIP attention fell 10%, and MEGA and MACRO both fell 6% for non-leaders, even as leaders posted VIP gains of 2% and MEGA gains of 18%. And leaders built a larger organic base before layering paid on top, earning 78% of holiday attention organically versus 71% for the rest of the market, a pattern that held in four of five categories. Even so, paid attention outpaced organic gains everywhere: sponsored attention grew 77% year over year across categories while organic attention grew just 5%.
Boosting results varied sharply by category. Personal Care and Fashion converted heavier boosting into gains of 121% and 89% in saves and shares per view, while Adult Beverage boosted hardest, with an 83% increase in boost weight, yet lost 82% on the same measure.
BFCM Flooded the Feed, Gift Guides Held Their Value
Across the broader market, every major holiday content theme grew in volume, but attention per post fell in nearly all of them. Black Friday/Cyber Monday content grew 152% year over year while average attention per post collapsed 63%. Gift guides were the exception, the only theme to grow both post volume (+20%) and attention per post (+17%) at once. In affiliate commerce, TikTok Shop and ShopMy attention grew 161% and 157%, respectively, while LTK and Amazon both declined.
The pattern continued into early 2026: attention grew in Beauty, Personal Care, and Adult Beverage, but attention per post fell in every category, down 43% overall. TikTok posted 136% more content yet lost 58% in attention per post; YouTube was the only platform to grow total attention, up 3%, while barely increasing volume.
What Wins Inside the Post
A separate multimodal AI analysis of 10,279 posts found that content featuring six to ten brands earned 2.44 times the median Instagram saves, compared with 0.66 times for single-brand posts. Close-up shots in home settings outperformed full-body looks at events, and warm color palettes, particularly peach (3.54x Instagram saves) and burgundy (2.67x), beat cool metallics like silver, which fell to 0.56 times median TikTok saves. Only 24% of posts included a clear call to action, despite posts with CTAs earning 1.35 times as many saves on Instagram and 1.16 times as many on TikTok as posts without them.
“The brands that will have the greatest impact during the 2026 holiday season cultivate creator partnerships year-round,” said Harry Rein, CEO and co-founder of ShopMy.
Traackr CEO Pierre-Loïc Assayag framed the takeaway similarly: “The brands that consistently outperform aren’t necessarily doing more. They’re planning earlier, building on trusted creator relationships, measuring what matters, and adapting quickly as the season unfolds.”
Dragomir is a Serbian freelance blog writer and translator. He is passionate about covering insightful stories and exploring topics such as influencer marketing, the creator economy, technology, business, and cyber fraud.




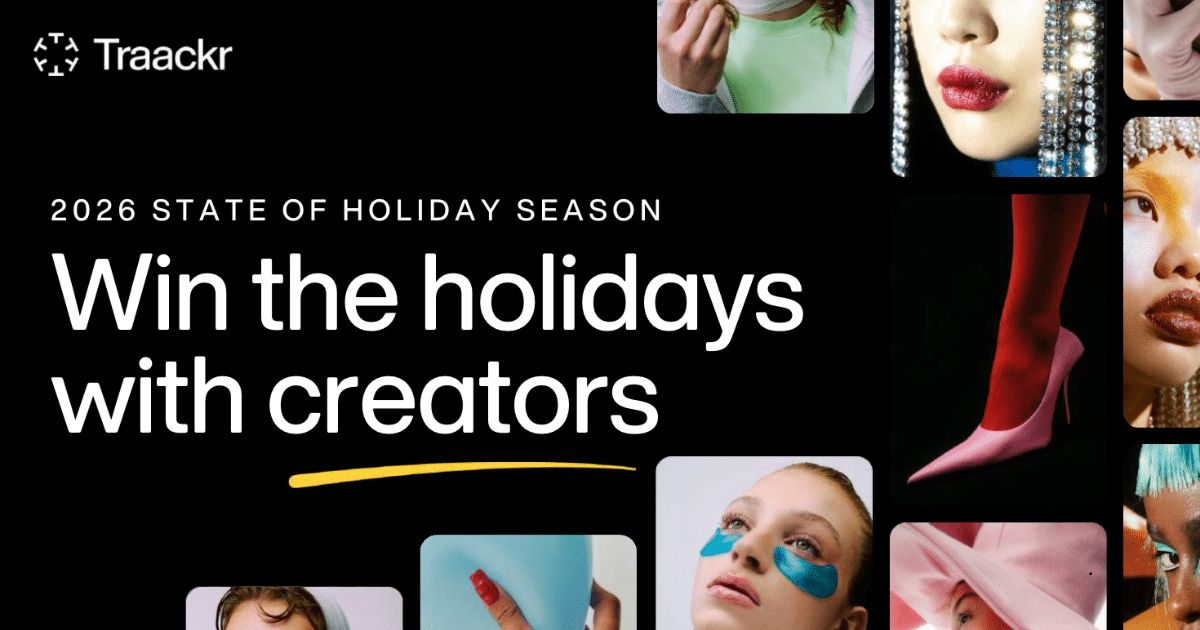








Creator content aimed at the 2025 holiday season grew faster than any previous year on record, and the flood mostly did not pay off. According to a new report from Traackr, drawing on more than 770,000 creators and 12 million pieces of content across Beauty, Personal Care, Fashion, Food & Beverage, and Adult Beverage, overall holiday creator posts rose 73% year over year, with Personal Care more than doubling (+132%) and Beauty nearly doing the same (+95%).
But a separate benchmark of the Top 25 brands by Traackr’s Brand Vitality Score (VIT) against the rest of the market shows the extra volume did not translate evenly into results. The brands that came out ahead did not simply post more. They built different relationships before the season started.
Creator Spend Rose With the Content
Payment data provided by Lumanu, drawn from more than 140,000 creator payouts totaling over $600 million in flat-fee social spend, shows total creator spend climbed roughly 60% from spring 2025 to its December peak. The median December payout hit $1,750, the highest of the year, up from a typical $1,100 to $1,200.
Per-post pricing ranged from $600 for a solo TikTok to $2,500 for a standalone Instagram Reel, with YouTube at $700 and Instagram Stories and Feed at $1,166 and $1,200 respectively. Once a deal bundled multiple deliverables, which happened 58% of the time for Reels, pricing consolidated into a tight $4,600 to $5,600 band regardless of channel mix.
“You can see the holiday crush in the payment data before you see it anywhere else: prices climb, the same creators get booked again and again, and everyone is competing for the same few weeks,” said Tony Tran, CEO and founder of Lumanu.
What Separated Leaders From the Rest
Traackr’s Top 25 brands in each category earned 57% of their holiday attention from retained creators, meaning those who mentioned the brand in both Q3 and Q4 2025, compared with 51% for the rest of the market. The gap was widest in Beauty, where leaders pulled 70% of attention from returning creators versus 52% for everyone else; Personal Care was the lone exception, with leaders’ retained share running 17 points below the market’s.
Leaders also grew attention across every creator tier, from VIP down to nano, while the rest of the market lost ground at the top: VIP attention fell 10%, and MEGA and MACRO both fell 6% for non-leaders, even as leaders posted VIP gains of 2% and MEGA gains of 18%. And leaders built a larger organic base before layering paid on top, earning 78% of holiday attention organically versus 71% for the rest of the market, a pattern that held in four of five categories. Even so, paid attention outpaced organic gains everywhere: sponsored attention grew 77% year over year across categories while organic attention grew just 5%.
Boosting results varied sharply by category. Personal Care and Fashion converted heavier boosting into gains of 121% and 89% in saves and shares per view, while Adult Beverage boosted hardest, with an 83% increase in boost weight, yet lost 82% on the same measure.
BFCM Flooded the Feed, Gift Guides Held Their Value
Across the broader market, every major holiday content theme grew in volume, but attention per post fell in nearly all of them. Black Friday/Cyber Monday content grew 152% year over year while average attention per post collapsed 63%. Gift guides were the exception, the only theme to grow both post volume (+20%) and attention per post (+17%) at once. In affiliate commerce, TikTok Shop and ShopMy attention grew 161% and 157%, respectively, while LTK and Amazon both declined.
The pattern continued into early 2026: attention grew in Beauty, Personal Care, and Adult Beverage, but attention per post fell in every category, down 43% overall. TikTok posted 136% more content yet lost 58% in attention per post; YouTube was the only platform to grow total attention, up 3%, while barely increasing volume.
What Wins Inside the Post
A separate multimodal AI analysis of 10,279 posts found that content featuring six to ten brands earned 2.44 times the median Instagram saves, compared with 0.66 times for single-brand posts. Close-up shots in home settings outperformed full-body looks at events, and warm color palettes, particularly peach (3.54x Instagram saves) and burgundy (2.67x), beat cool metallics like silver, which fell to 0.56 times median TikTok saves. Only 24% of posts included a clear call to action, despite posts with CTAs earning 1.35 times as many saves on Instagram and 1.16 times as many on TikTok as posts without them.
“The brands that will have the greatest impact during the 2026 holiday season cultivate creator partnerships year-round,” said Harry Rein, CEO and co-founder of ShopMy.
Traackr CEO Pierre-Loïc Assayag framed the takeaway similarly: “The brands that consistently outperform aren’t necessarily doing more. They’re planning earlier, building on trusted creator relationships, measuring what matters, and adapting quickly as the season unfolds.”
Image source: Traackr
Get the full report here
Subscribe to Our Newsletter
Check Out Our Podcast