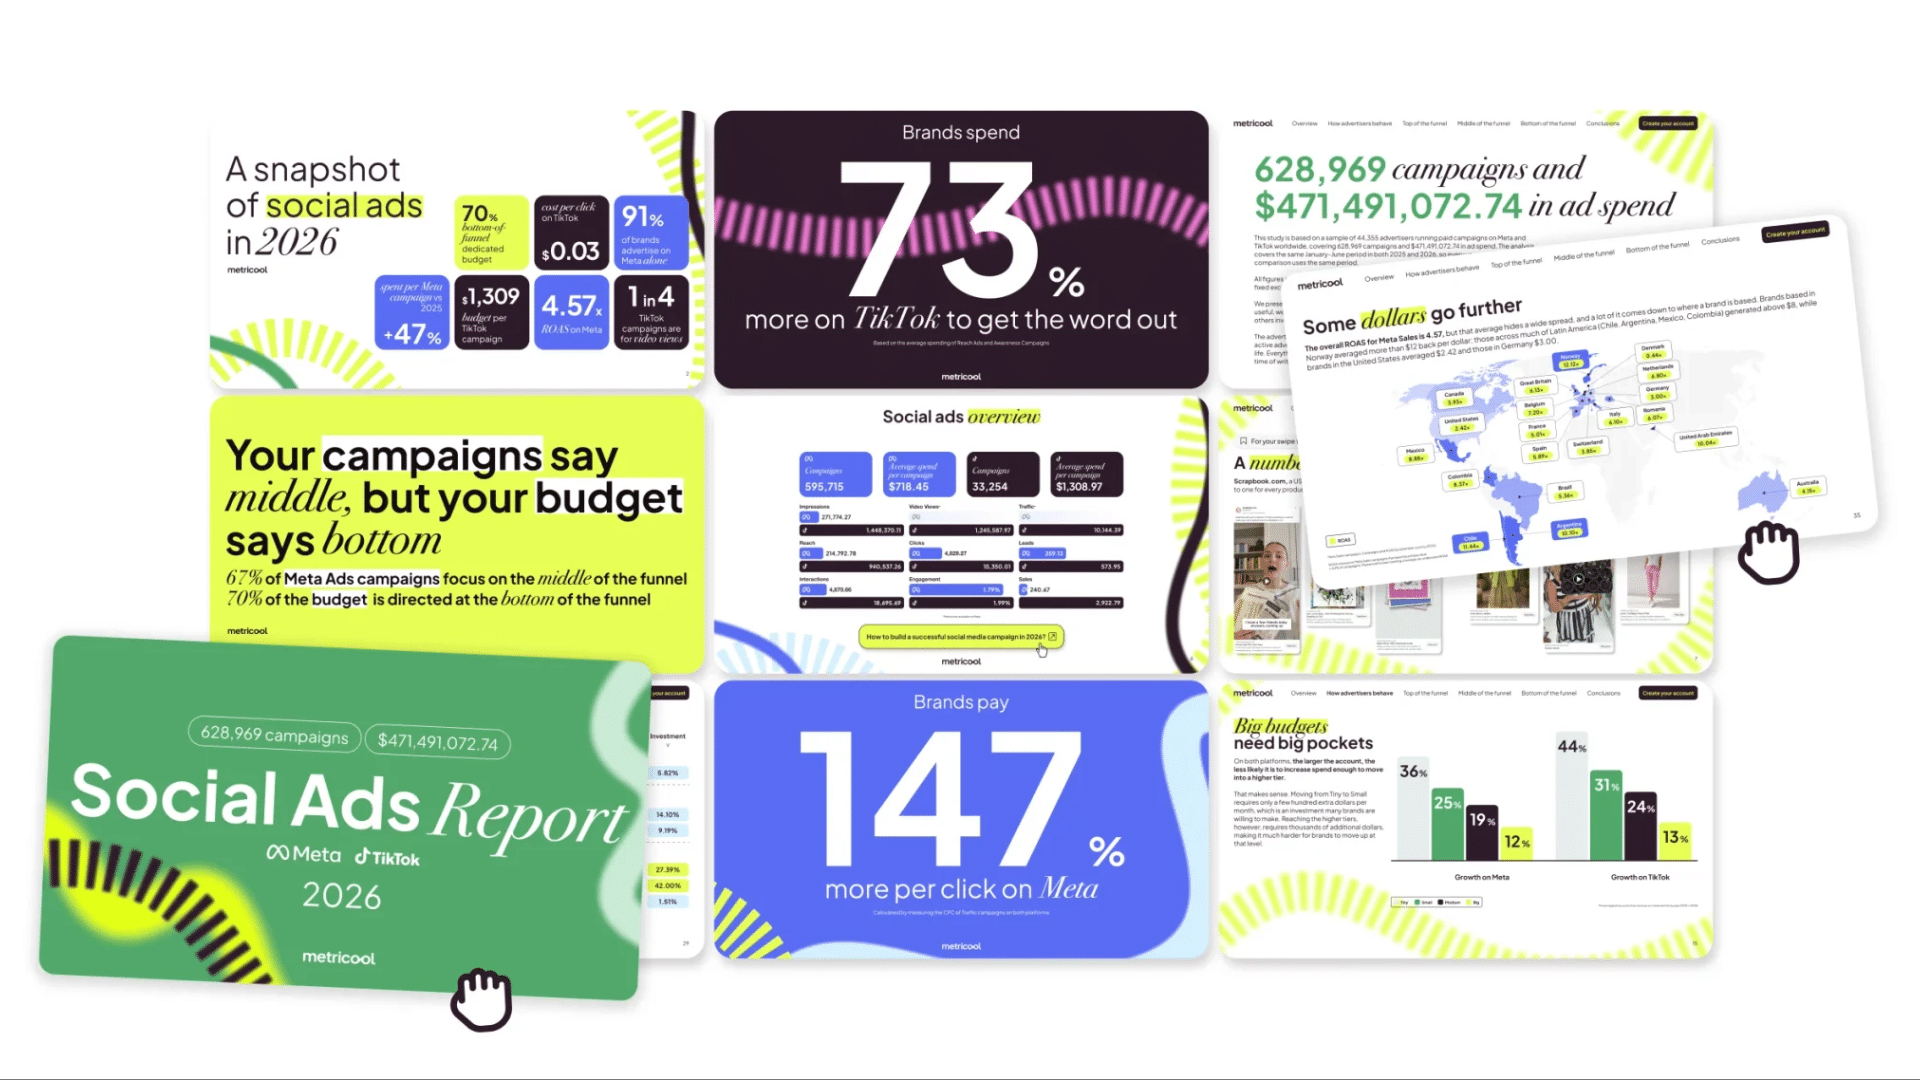
Advertisers running Meta Sales campaigns generated $4.57 in revenue for every dollar spent in 2026, down from $5.48 in 2025, according to a new report from Metricool. The decline came even as total analyzed ad spend on those campaigns more than doubled, from $62.9 million to $151.8 million, and purchase value rose from $344.8 million to $694.4 million, meaning revenue grew but not as fast as the money advertisers put behind it.
The report is based on a sample of 44,355 advertisers running paid campaigns on Meta and TikTok, covering 628,969 campaigns and $471,491,072.74 in ad spend across the same January-to-June period in both 2025 and 2026. All figures come from Metricool and reflect its analysis of advertiser behavior on the two platforms.
Meta Still Dominates Where Advertisers Spend
Despite the softening returns, Meta remains the default platform. Metricool found that 91% of the 44,355 advertisers in its sample run paid campaigns exclusively on Meta, compared with 5% on TikTok only and 4% on both. Among the smaller subset of advertisers running campaigns on both platforms, Meta still commands the larger share of combined budget, though that share slipped from 76.4% in 2025 to 74.3% in 2026 as TikTok picked up the difference.
The shift toward TikTok was most pronounced among the smallest advertisers, whose split moved to a near-even 56% Meta, 44% TikTok, compared with a far more lopsided split at the largest spending tier.
TikTok Cheaper Almost Everywhere Except Engagement
Metricool’s funnel-stage breakdown shows TikTok undercutting Meta on cost at nearly every stage. At the top of the funnel, TikTok’s cost per thousand impressions came in at $0.38 against Meta’s $0.48. In the middle of the funnel, a TikTok traffic campaign generated nearly eight times more clicks than the same campaign type on Meta while costing less than half as much per click, $0.03 versus $0.07. At the bottom of the funnel, TikTok’s cost per lead was $2.69, down 33% year over year, compared with $6.00 on Meta, up 14%. TikTok Product Sales campaigns reported an even lower cost per conversion, $1.14 against Meta’s $11.14, though Metricool cautioned that TikTok’s Product Sales volume shrank sharply, to 297 campaigns in 2026 from 1,093 in 2025, meaning the figure reflects a smaller, self-selected group of advertisers rather than a broad trend.
Meta’s advantage appears in engagement. The platform posted a similar engagement rate to TikTok, 2.15% versus 1.99%, while spending far less per campaign, and it generated more interactions per dollar: 10.8 on Meta compared with 8.2 on TikTok.
Budgets Concentrate at the Bottom of the Funnel on Both Platforms
Metricool’s data shows a mismatch between where advertisers run the most campaigns and where they put the most money. On Meta, 67% of campaigns target traffic or engagement, the middle of the funnel, but 70.9% of total spend is concentrated at the bottom, with Sales campaigns alone accounting for 42% of spend despite representing just 11% of campaigns. Awareness campaigns, by contrast, take up a modest 5.82% of Meta budgets.
TikTok shows a similar, if less extreme, pattern. Video views draw the largest share of TikTok campaigns and spend in the middle of the funnel, but 58.2% of total TikTok spend still goes to the bottom of the funnel, compared with 32.7% of campaigns. Web conversions account for 27.7% of TikTok spend, and app promotion campaigns, while representing just 1.8% of TikTok campaigns, take 11% of total investment, pointing to a smaller number of high-budget app campaigns.
Size Doesn’t Guarantee Better Returns
Metricool’s report also found that Meta’s largest advertisers, those spending more than $10,000 a month, posted the lowest ROAS of any account size tier in both years, 4.88 in 2025 and 3.97 in 2026, trailing even the smallest advertisers. Returns also varied widely by advertiser location: brands based in Norway averaged more than $12 back per dollar spent, and several Latin American markets, including Chile, Argentina, Mexico, and Colombia, generated above $8, while U.S.-based advertisers averaged $2.42.
Image source: Metricool The full report can be found here
Dragomir is a Serbian freelance blog writer and translator. He is passionate about covering insightful stories and exploring topics such as influencer marketing, the creator economy, technology, business, and cyber fraud.

















Advertisers running Meta Sales campaigns generated $4.57 in revenue for every dollar spent in 2026, down from $5.48 in 2025, according to a new report from Metricool. The decline came even as total analyzed ad spend on those campaigns more than doubled, from $62.9 million to $151.8 million, and purchase value rose from $344.8 million to $694.4 million, meaning revenue grew but not as fast as the money advertisers put behind it.
The report is based on a sample of 44,355 advertisers running paid campaigns on Meta and TikTok, covering 628,969 campaigns and $471,491,072.74 in ad spend across the same January-to-June period in both 2025 and 2026. All figures come from Metricool and reflect its analysis of advertiser behavior on the two platforms.
Meta Still Dominates Where Advertisers Spend
Despite the softening returns, Meta remains the default platform. Metricool found that 91% of the 44,355 advertisers in its sample run paid campaigns exclusively on Meta, compared with 5% on TikTok only and 4% on both. Among the smaller subset of advertisers running campaigns on both platforms, Meta still commands the larger share of combined budget, though that share slipped from 76.4% in 2025 to 74.3% in 2026 as TikTok picked up the difference.
The shift toward TikTok was most pronounced among the smallest advertisers, whose split moved to a near-even 56% Meta, 44% TikTok, compared with a far more lopsided split at the largest spending tier.
TikTok Cheaper Almost Everywhere Except Engagement
Metricool’s funnel-stage breakdown shows TikTok undercutting Meta on cost at nearly every stage. At the top of the funnel, TikTok’s cost per thousand impressions came in at $0.38 against Meta’s $0.48. In the middle of the funnel, a TikTok traffic campaign generated nearly eight times more clicks than the same campaign type on Meta while costing less than half as much per click, $0.03 versus $0.07. At the bottom of the funnel, TikTok’s cost per lead was $2.69, down 33% year over year, compared with $6.00 on Meta, up 14%. TikTok Product Sales campaigns reported an even lower cost per conversion, $1.14 against Meta’s $11.14, though Metricool cautioned that TikTok’s Product Sales volume shrank sharply, to 297 campaigns in 2026 from 1,093 in 2025, meaning the figure reflects a smaller, self-selected group of advertisers rather than a broad trend.
Meta’s advantage appears in engagement. The platform posted a similar engagement rate to TikTok, 2.15% versus 1.99%, while spending far less per campaign, and it generated more interactions per dollar: 10.8 on Meta compared with 8.2 on TikTok.
Budgets Concentrate at the Bottom of the Funnel on Both Platforms
Metricool’s data shows a mismatch between where advertisers run the most campaigns and where they put the most money. On Meta, 67% of campaigns target traffic or engagement, the middle of the funnel, but 70.9% of total spend is concentrated at the bottom, with Sales campaigns alone accounting for 42% of spend despite representing just 11% of campaigns. Awareness campaigns, by contrast, take up a modest 5.82% of Meta budgets.
TikTok shows a similar, if less extreme, pattern. Video views draw the largest share of TikTok campaigns and spend in the middle of the funnel, but 58.2% of total TikTok spend still goes to the bottom of the funnel, compared with 32.7% of campaigns. Web conversions account for 27.7% of TikTok spend, and app promotion campaigns, while representing just 1.8% of TikTok campaigns, take 11% of total investment, pointing to a smaller number of high-budget app campaigns.
Size Doesn’t Guarantee Better Returns
Metricool’s report also found that Meta’s largest advertisers, those spending more than $10,000 a month, posted the lowest ROAS of any account size tier in both years, 4.88 in 2025 and 3.97 in 2026, trailing even the smallest advertisers. Returns also varied widely by advertiser location: brands based in Norway averaged more than $12 back per dollar spent, and several Latin American markets, including Chile, Argentina, Mexico, and Colombia, generated above $8, while U.S.-based advertisers averaged $2.42.
Image source: Metricool
The full report can be found here
Subscribe to Our Newsletter
Check Out Our Podcast