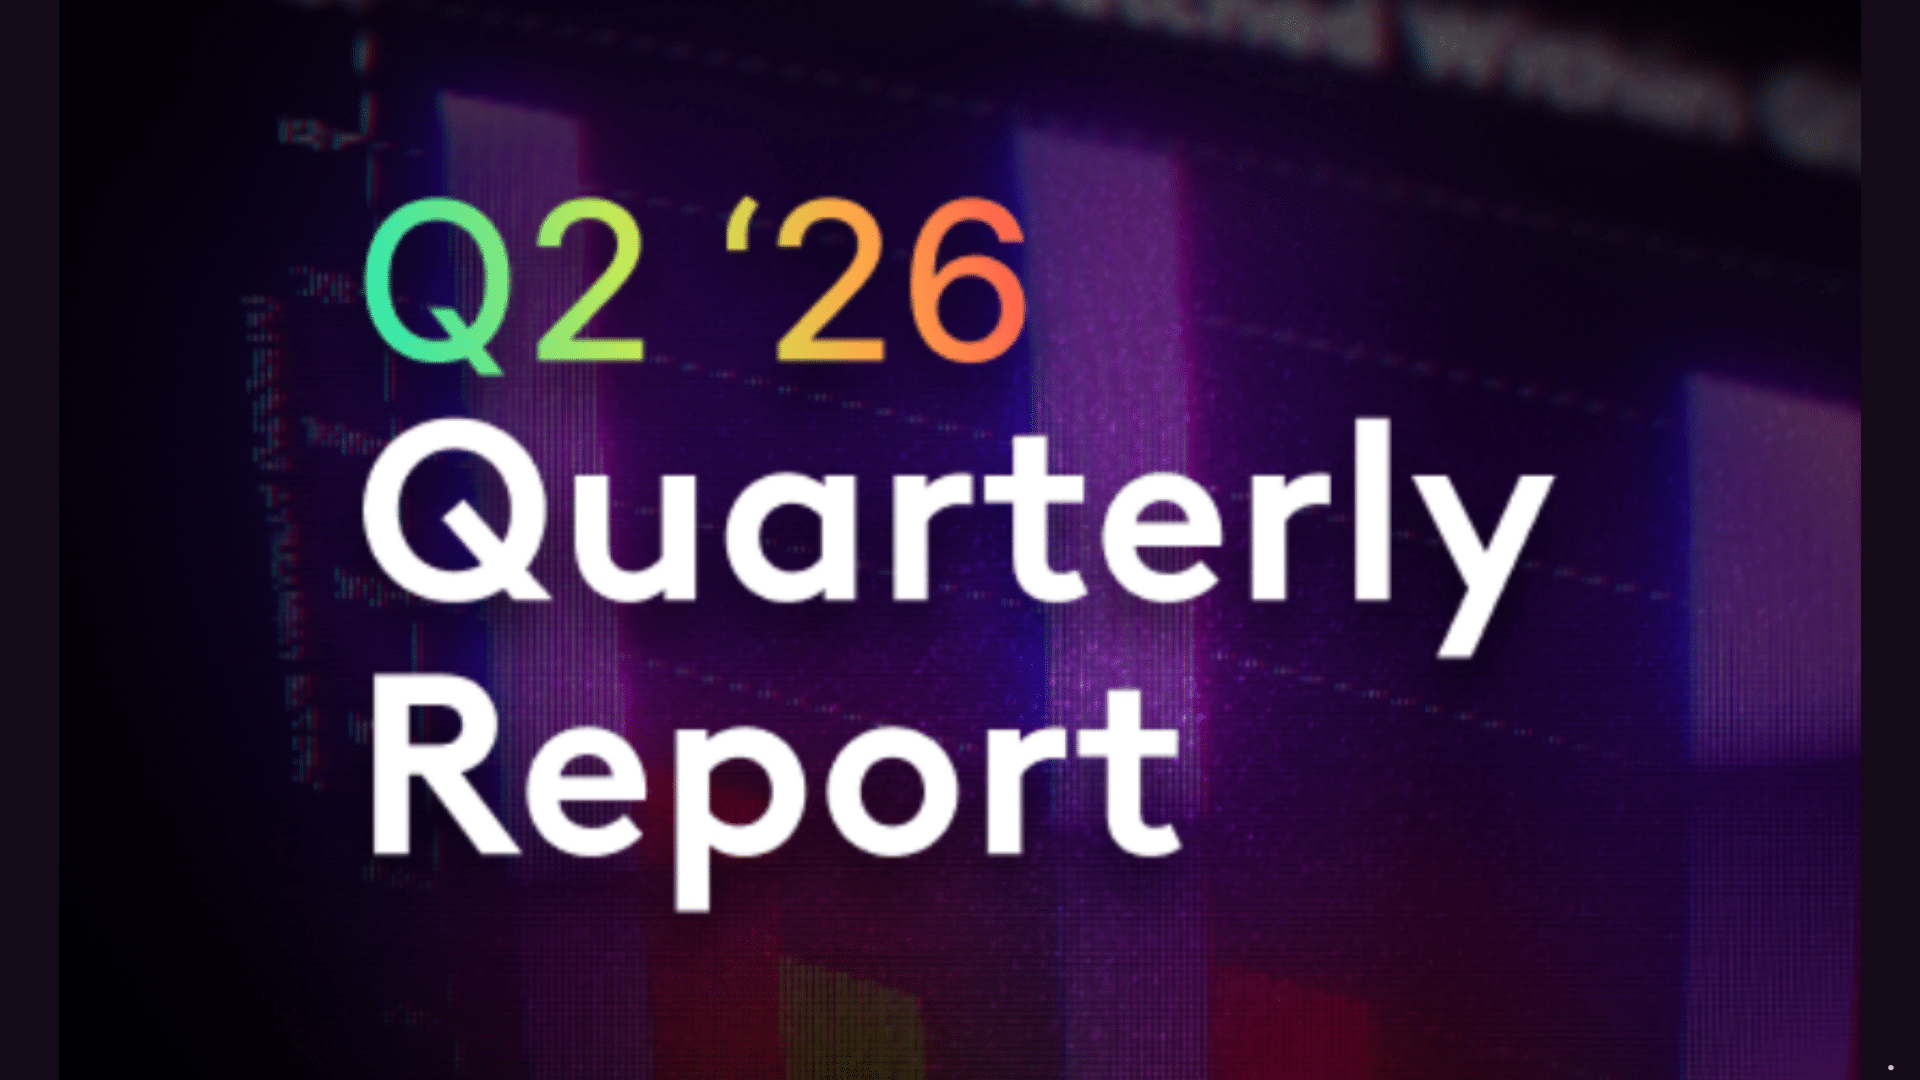
Livestreaming viewership across major platforms was essentially flat quarter over quarter in the second quarter of 2026, according to a new report from Streamlabs and Hatchet, masking a sharp divergence in fortunes among individual platforms. Total hours watched reached 21.5 billion, up just 0.1% from the first quarter but 7.6% higher than the second quarter of 2025.
YouTube Live’s growth played a major role, offsetting declines elsewhere in the industry. YouTube Gaming, by contrast, posted its first year-over-year decline in more than a year, and Facebook Gaming’s slide accelerated further.
YouTube Live Widens Its Share, YouTube Gaming Reverses Course
YouTube Live hours watched rose 2.7% quarter over quarter and 18.0% year over year to 12.97 billion, increasing its share of total industry watch time to 60.3%, up from 58.8% in the first quarter. This is the first report in which Streamlabs and Hatchet have tracked YouTube Live alongside YouTube Gaming as a separate category, a change the report attributes to IRL talk and variety content accounting for a growing share of live-streaming viewership.
YouTube Gaming moved in the opposite direction. Hours watched fell 19.3% quarter over quarter and 18.9% year over year to 1.79 billion. Unique channels on the platform dropped 28.2% year over year, the steepest decline among major platforms tracked in the report. The report notes some of the gap may reflect viewing shifting toward general YouTube Live placements rather than gaming-specific ones.
Twitch Stabilizes, Kick Growth Slows but Continues
Twitch showed further signs of stabilization. Hours watched dipped just 0.7% quarter over quarter, and the year-over-year decline improved to 8.3%, from 13.7% in the first quarter. Average concurrent viewers per channel on Twitch rose 7.2% to 22.6. Just Chatting remained Twitch’s top category at 670.5 million hours watched, with League of Legends a distant second.
Kick remained the fastest-growing major platform despite slowing momentum. Hours watched rose 5.5% quarter over quarter and 36.7% year over year to 1.34 billion, though annual growth slowed from 65.3% in the first quarter. Unique channels on Kick increased 45.5% year over year to 807.7 thousand, and June was the platform’s strongest month of the quarter at 520 million hours watched.
Facebook Gaming’s Decline Deepens
Facebook Gaming’s contraction accelerated in the quarter. Hours watched fell 45.5% quarter over quarter and 64.8% year over year to 14.8 million, the lowest level in the dataset. Watch time on the platform has dropped more than 75% since the fourth quarter of 2025, leaving it with roughly 0.1% of total industry watch time.
Among smaller platforms, Steam posted the strongest growth, up 56.7% quarter over quarter to 113.6 million hours watched. Rumble rebounded 16.1% quarter over quarter to 79.4 million hours but remained down 37.1% year over year. Chzzk grew 9.4% quarter over quarter and 19.4% year over year, while Afreeca was roughly flat and Bigo posted modest gains. None of these platforms accounted for more than 1.5% of total watch time.
Creator Counts Fall Across Most Platforms
Unique broadcasting channels declined across nearly every major platform. Twitch fell 9.1% quarter over quarter to 7.94 million channels, YouTube Gaming dropped 17.9% to 878 thousand, and YouTube Live fell 19.7% to 699 thousand. Kick was the exception, growing 5.4% quarter over quarter and 45.5% year over year to 807.7 thousand channels.
Audience concentration varied widely by platform. YouTube Live had the highest concentration at roughly 308 viewers per channel, up 13.4% quarter over quarter but down 14.4% year over year. Kick followed at about 85 viewers per channel and YouTube Gaming at 78, both above Twitch’s roughly 23 viewers per channel.
Non-Gaming Content and League of Legends Lead Viewership
Just Chatting and other non-gaming content remained the industry’s biggest draw, leading overall viewership and topping both Twitch and Kick. Non-gaming content reached 1.076 billion hours watched industry-wide. First-person shooters were the most-streamed genre overall, a gap the report notes between what creators broadcast and what audiences watch.
Riot Games remained the top publisher across Twitch, YouTube Gaming, Afreeca, Chzzk, and the industry overall, with 535.8 million hours watched, down from 594.5 million in the first quarter. Rockstar led on Kick, Moonton led on Facebook, and Valve led on Steam.
League of Legends dominated esports viewership in the quarter, accounting for the three largest events: the LCK Rounds 1-2 (87.7 million hours watched, 392,884 average minute audience), the LEC Spring Split (23.6 million hours watched, 190,279 average minute audience), and the Mid-Season Invitational (9.4 million hours watched and a quarter-high 664,309 average minute audience). That marked a shift from the first quarter, when the top events were split across Counter-Strike, VALORANT, and League of Legends.
Image source: Streamlabs & Hatchet The full report is available here
Dragomir is a Serbian freelance blog writer and translator. He is passionate about covering insightful stories and exploring topics such as influencer marketing, the creator economy, technology, business, and cyber fraud.










Livestreaming viewership across major platforms was essentially flat quarter over quarter in the second quarter of 2026, according to a new report from Streamlabs and Hatchet, masking a sharp divergence in fortunes among individual platforms. Total hours watched reached 21.5 billion, up just 0.1% from the first quarter but 7.6% higher than the second quarter of 2025.
YouTube Live’s growth played a major role, offsetting declines elsewhere in the industry. YouTube Gaming, by contrast, posted its first year-over-year decline in more than a year, and Facebook Gaming’s slide accelerated further.
YouTube Live Widens Its Share, YouTube Gaming Reverses Course
YouTube Live hours watched rose 2.7% quarter over quarter and 18.0% year over year to 12.97 billion, increasing its share of total industry watch time to 60.3%, up from 58.8% in the first quarter. This is the first report in which Streamlabs and Hatchet have tracked YouTube Live alongside YouTube Gaming as a separate category, a change the report attributes to IRL talk and variety content accounting for a growing share of live-streaming viewership.
YouTube Gaming moved in the opposite direction. Hours watched fell 19.3% quarter over quarter and 18.9% year over year to 1.79 billion. Unique channels on the platform dropped 28.2% year over year, the steepest decline among major platforms tracked in the report. The report notes some of the gap may reflect viewing shifting toward general YouTube Live placements rather than gaming-specific ones.
Twitch Stabilizes, Kick Growth Slows but Continues
Twitch showed further signs of stabilization. Hours watched dipped just 0.7% quarter over quarter, and the year-over-year decline improved to 8.3%, from 13.7% in the first quarter. Average concurrent viewers per channel on Twitch rose 7.2% to 22.6. Just Chatting remained Twitch’s top category at 670.5 million hours watched, with League of Legends a distant second.
Kick remained the fastest-growing major platform despite slowing momentum. Hours watched rose 5.5% quarter over quarter and 36.7% year over year to 1.34 billion, though annual growth slowed from 65.3% in the first quarter. Unique channels on Kick increased 45.5% year over year to 807.7 thousand, and June was the platform’s strongest month of the quarter at 520 million hours watched.
Facebook Gaming’s Decline Deepens
Facebook Gaming’s contraction accelerated in the quarter. Hours watched fell 45.5% quarter over quarter and 64.8% year over year to 14.8 million, the lowest level in the dataset. Watch time on the platform has dropped more than 75% since the fourth quarter of 2025, leaving it with roughly 0.1% of total industry watch time.
Among smaller platforms, Steam posted the strongest growth, up 56.7% quarter over quarter to 113.6 million hours watched. Rumble rebounded 16.1% quarter over quarter to 79.4 million hours but remained down 37.1% year over year. Chzzk grew 9.4% quarter over quarter and 19.4% year over year, while Afreeca was roughly flat and Bigo posted modest gains. None of these platforms accounted for more than 1.5% of total watch time.
Creator Counts Fall Across Most Platforms
Unique broadcasting channels declined across nearly every major platform. Twitch fell 9.1% quarter over quarter to 7.94 million channels, YouTube Gaming dropped 17.9% to 878 thousand, and YouTube Live fell 19.7% to 699 thousand. Kick was the exception, growing 5.4% quarter over quarter and 45.5% year over year to 807.7 thousand channels.
Audience concentration varied widely by platform. YouTube Live had the highest concentration at roughly 308 viewers per channel, up 13.4% quarter over quarter but down 14.4% year over year. Kick followed at about 85 viewers per channel and YouTube Gaming at 78, both above Twitch’s roughly 23 viewers per channel.
Non-Gaming Content and League of Legends Lead Viewership
Just Chatting and other non-gaming content remained the industry’s biggest draw, leading overall viewership and topping both Twitch and Kick. Non-gaming content reached 1.076 billion hours watched industry-wide. First-person shooters were the most-streamed genre overall, a gap the report notes between what creators broadcast and what audiences watch.
Riot Games remained the top publisher across Twitch, YouTube Gaming, Afreeca, Chzzk, and the industry overall, with 535.8 million hours watched, down from 594.5 million in the first quarter. Rockstar led on Kick, Moonton led on Facebook, and Valve led on Steam.
League of Legends dominated esports viewership in the quarter, accounting for the three largest events: the LCK Rounds 1-2 (87.7 million hours watched, 392,884 average minute audience), the LEC Spring Split (23.6 million hours watched, 190,279 average minute audience), and the Mid-Season Invitational (9.4 million hours watched and a quarter-high 664,309 average minute audience). That marked a shift from the first quarter, when the top events were split across Counter-Strike, VALORANT, and League of Legends.
Image source: Streamlabs & Hatchet
The full report is available here
Subscribe to Our Newsletter
Check Out Our Podcast