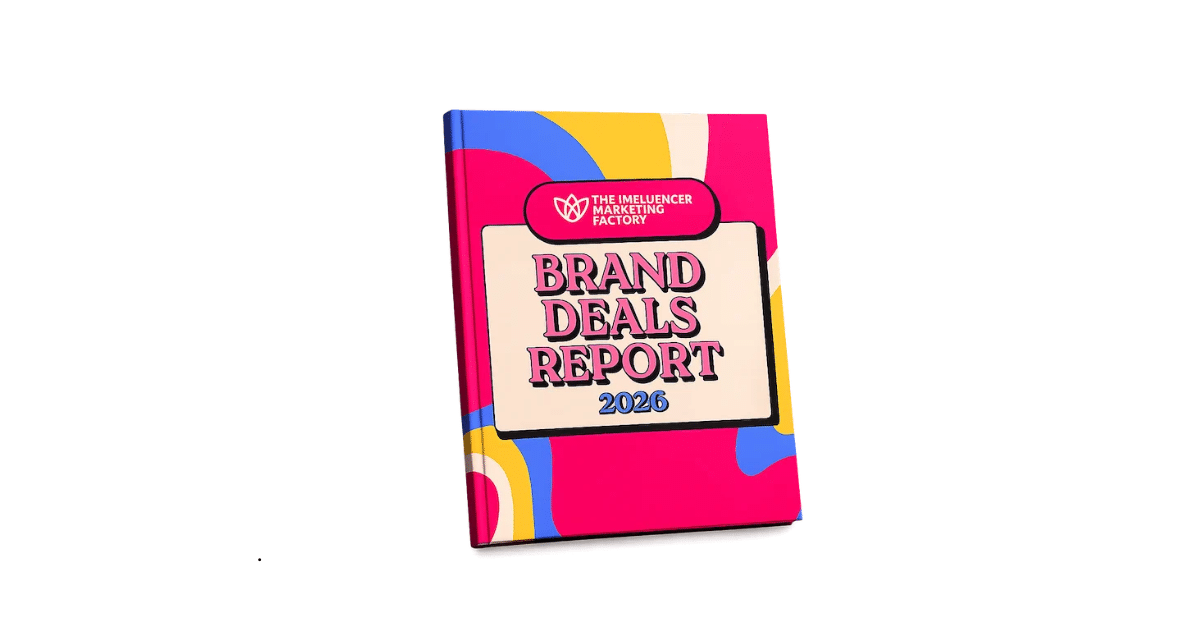
The Influencer Marketing Factory’s “Brand Deals Report 2026” found that one-off creator partnerships remain the dominant format across Instagram, TikTok, and YouTube, even as repeat collaborations account for a larger share of creator-brand activity on YouTube.
The report analyzed U.S.-based creators with promoted posts across the three platforms, covering 3,156 TikTok creators and 90,434 promoted posts, 2,341 Instagram creators and 105,939 promoted posts, and 2,360 YouTube creators and 120,019 promoted posts. The sample used platform-specific filters, including English-language content, at least 30% U.S. audience, recent creator activity, sponsored posts, engagement and audience credibility thresholds, and contact availability where applicable. Disclosure classification was based on native platform flags, caption analysis, disclosure hashtags, and commercial intent signals.
One-Off Deals Still Dominate
The report found that one-off relationships account for 68.5% of Instagram brand collaborations, 71.8% on TikTok, and 49.1% on YouTube. Across the U.S. dataset, The Influencer Marketing Factory said an average of 63% of brand-influencer relationships are one-off.
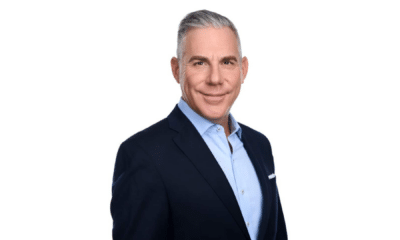
Alessandro Bogliari, CEO and co-founder of The Influencer Marketing Factory, framed the pattern as a structural issue in how brands approach Influencer Marketing. “An average of 63% of brand-influencer relationships in our U.S. dataset are one-off,” Bogliari wrote in the report. “Brands hire an influencer, run one post, and move on.”
The report found that YouTube has the highest repeat brand collaboration rate among the three platforms at 50.9%, compared with 31.5% on Instagram and 28.2% on TikTok. YouTube also posted the longest average brand partnership duration among repeat relationships, at 13.5 months. Instagram averaged 7.7 months, while TikTok averaged 4.9 months.
YouTube Shows Retention Advantage
The report identified YouTube as the strongest platform for long-term creator partnerships. Its repeat collaboration rates exceeded those of Instagram and TikTok across creator tiers, with YouTube repeat collabs ranging from 36.2% to 48.9%. The 100,000-to-200,000 follower tier recorded the highest YouTube repeat collaboration rate at 48.9%.
Affiliate partnerships represented 52.9% of YouTube brand partnerships, surpassing paid deals at 41.4% and unspecified deal types at 4.7%. The report said this structure differs from Instagram and TikTok, where paid and unspecified formats dominate.
The report also found that YouTube partnerships run longer across tiers than those on the other platforms. YouTube’s longest average partnership length appeared in the 400,000-to-700,000 creator tier, at 20.2 months. By comparison, Instagram’s longest average partnership length appeared among 10,000-to-25,000 follower creators, at 9.3 months, while TikTok’s longest appeared among 700,000-to-1 million follower creators, at 5.9 months.
Disclosure Rates Vary by Platform
TikTok recorded the highest paid content disclosure rate among the three platforms. The report found that 52% of TikTok promoted posts were properly disclosed, compared with 42% on YouTube and 29% on Instagram.
Instagram had the highest share of posts labeled likely hidden or unclear in the report’s disclosure split. The report said 61% of Instagram posts were likely undisclosed partnerships, while 10% were unclear. YouTube had a 58% hidden rate, though the report noted that YouTube used a binary disclosed-or-hidden classification, with no unclear category.
The report also found that disclosure behavior varies by creator size. TikTok nano creators in the 10,000-to-25,000 follower tier had the highest disclosure rate on that platform, at 62.9%, while disclosure declined through several larger tiers before rising again. On Instagram, disclosure rose from 23.6% for the 10,000-to-25,000 tier to 43% for creators with 1 million to 1.5 million followers. On YouTube, disclosure increased from 15.8% for the 10,000-to-25,000 tier to a peak of 39.2% for the 2 million-to-3 million tier.
Retail Leads Brand Categories
Retail dominated influencer collaboration volume across platforms, according to the report. TikTok had the highest retail concentration at 41.6%, followed by Instagram at 29.6% and YouTube at 20.9%.
TikTok also had a strong consumer packaged goods presence, with CPG accounting for 32.7% of collaborations. Instagram had the highest Media & Entertainment share at 27.1%, compared with 18.6% on YouTube and 7.6% on TikTok. YouTube led in Technology at 22.9%, compared with 5.9% on TikTok and 5% on Instagram.
Fashion Nova ranked as the top brand by total collaborations on both TikTok and Instagram, with 1,109 TikTok collaborations and 887 Instagram collaborations. On YouTube, Squarespace led with 6,904 collaborations, followed by PrizePicks with 3,706 and SeatGeek with 3,067.
Seasonality Differs Across Platforms
The report found that influencer collaboration volume does not peak at the same time across platforms. TikTok peaked in January, which accounted for 12.1% of its annual collaboration volume. Instagram peaked in November at 9.9%, while YouTube peaked in December at 11.4%.
Q4 remained the most active period overall, accounting for 29% of annual collaboration volume on TikTok, 29% on Instagram, and 31% on YouTube. Q2 was the weakest quarter across platforms, with TikTok and YouTube each at 17% and Instagram at 20%.
Posting patterns were also weekday-heavy. The report found that 80% of promotional Instagram posts appeared on weekdays, compared with 78% on TikTok and 73% on YouTube.
Image source: The Influencer Marketing Factory Get the full report here
Dragomir is a Serbian freelance blog writer and translator. He is passionate about covering insightful stories and exploring topics such as influencer marketing, the creator economy, technology, business, and cyber fraud.










The Influencer Marketing Factory’s “Brand Deals Report 2026” found that one-off creator partnerships remain the dominant format across Instagram, TikTok, and YouTube, even as repeat collaborations account for a larger share of creator-brand activity on YouTube.
The report analyzed U.S.-based creators with promoted posts across the three platforms, covering 3,156 TikTok creators and 90,434 promoted posts, 2,341 Instagram creators and 105,939 promoted posts, and 2,360 YouTube creators and 120,019 promoted posts. The sample used platform-specific filters, including English-language content, at least 30% U.S. audience, recent creator activity, sponsored posts, engagement and audience credibility thresholds, and contact availability where applicable. Disclosure classification was based on native platform flags, caption analysis, disclosure hashtags, and commercial intent signals.
One-Off Deals Still Dominate
The report found that one-off relationships account for 68.5% of Instagram brand collaborations, 71.8% on TikTok, and 49.1% on YouTube. Across the U.S. dataset, The Influencer Marketing Factory said an average of 63% of brand-influencer relationships are one-off.
Alessandro Bogliari, CEO and co-founder of The Influencer Marketing Factory, framed the pattern as a structural issue in how brands approach Influencer Marketing. “An average of 63% of brand-influencer relationships in our U.S. dataset are one-off,” Bogliari wrote in the report. “Brands hire an influencer, run one post, and move on.”
The report found that YouTube has the highest repeat brand collaboration rate among the three platforms at 50.9%, compared with 31.5% on Instagram and 28.2% on TikTok. YouTube also posted the longest average brand partnership duration among repeat relationships, at 13.5 months. Instagram averaged 7.7 months, while TikTok averaged 4.9 months.
YouTube Shows Retention Advantage
The report identified YouTube as the strongest platform for long-term creator partnerships. Its repeat collaboration rates exceeded those of Instagram and TikTok across creator tiers, with YouTube repeat collabs ranging from 36.2% to 48.9%. The 100,000-to-200,000 follower tier recorded the highest YouTube repeat collaboration rate at 48.9%.
Affiliate partnerships represented 52.9% of YouTube brand partnerships, surpassing paid deals at 41.4% and unspecified deal types at 4.7%. The report said this structure differs from Instagram and TikTok, where paid and unspecified formats dominate.
The report also found that YouTube partnerships run longer across tiers than those on the other platforms. YouTube’s longest average partnership length appeared in the 400,000-to-700,000 creator tier, at 20.2 months. By comparison, Instagram’s longest average partnership length appeared among 10,000-to-25,000 follower creators, at 9.3 months, while TikTok’s longest appeared among 700,000-to-1 million follower creators, at 5.9 months.
Disclosure Rates Vary by Platform
TikTok recorded the highest paid content disclosure rate among the three platforms. The report found that 52% of TikTok promoted posts were properly disclosed, compared with 42% on YouTube and 29% on Instagram.
Instagram had the highest share of posts labeled likely hidden or unclear in the report’s disclosure split. The report said 61% of Instagram posts were likely undisclosed partnerships, while 10% were unclear. YouTube had a 58% hidden rate, though the report noted that YouTube used a binary disclosed-or-hidden classification, with no unclear category.
The report also found that disclosure behavior varies by creator size. TikTok nano creators in the 10,000-to-25,000 follower tier had the highest disclosure rate on that platform, at 62.9%, while disclosure declined through several larger tiers before rising again. On Instagram, disclosure rose from 23.6% for the 10,000-to-25,000 tier to 43% for creators with 1 million to 1.5 million followers. On YouTube, disclosure increased from 15.8% for the 10,000-to-25,000 tier to a peak of 39.2% for the 2 million-to-3 million tier.
Retail Leads Brand Categories
Retail dominated influencer collaboration volume across platforms, according to the report. TikTok had the highest retail concentration at 41.6%, followed by Instagram at 29.6% and YouTube at 20.9%.
TikTok also had a strong consumer packaged goods presence, with CPG accounting for 32.7% of collaborations. Instagram had the highest Media & Entertainment share at 27.1%, compared with 18.6% on YouTube and 7.6% on TikTok. YouTube led in Technology at 22.9%, compared with 5.9% on TikTok and 5% on Instagram.
Fashion Nova ranked as the top brand by total collaborations on both TikTok and Instagram, with 1,109 TikTok collaborations and 887 Instagram collaborations. On YouTube, Squarespace led with 6,904 collaborations, followed by PrizePicks with 3,706 and SeatGeek with 3,067.
Seasonality Differs Across Platforms
The report found that influencer collaboration volume does not peak at the same time across platforms. TikTok peaked in January, which accounted for 12.1% of its annual collaboration volume. Instagram peaked in November at 9.9%, while YouTube peaked in December at 11.4%.
Q4 remained the most active period overall, accounting for 29% of annual collaboration volume on TikTok, 29% on Instagram, and 31% on YouTube. Q2 was the weakest quarter across platforms, with TikTok and YouTube each at 17% and Instagram at 20%.
Posting patterns were also weekday-heavy. The report found that 80% of promotional Instagram posts appeared on weekdays, compared with 78% on TikTok and 73% on YouTube.
Image source: The Influencer Marketing Factory
Get the full report here
Subscribe to Our Newsletter
Check Out Our Podcast